SAGE has officially released its Global Statistical Report for the first quarter of 2023, using data obtained through SAGE Total Access. The Q1 report takes data of various distributor activities and compares it to previous quarters and years in an effort to get a glimpse of the state of the promotional products industry.
Overall, the results from the Q1 reports point to positive trends, which falls in line with what PPAI Research’s Q1 Survey had indicated about a strong start to 2023.
Notable Results
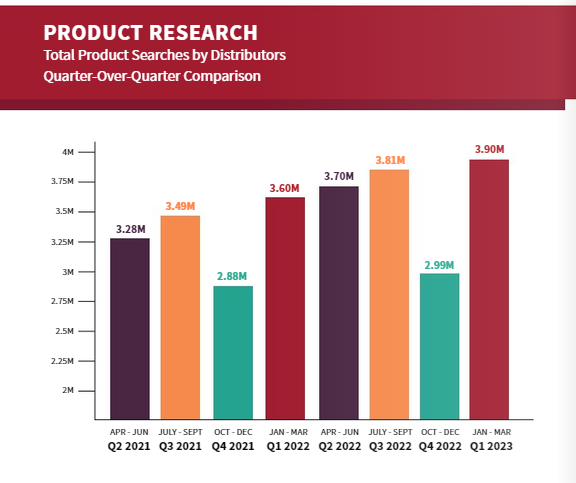
SAGE is a valuable tool for product searches, and so far in 2023, distributors are using it in this manner even more than they were in January, February and March of 2022.
In terms of total product searches:
- January 2023 yielded a 20% increase over January 2022.
- February 2023 yielded a 7% increase over February 2022.
- March 2023 yielded a 1% increase over March 2022.
As is often the case, the new year saw a big increase in product searches from distributors who began searching for orders to be delivered later in the year, after the usual dip during the holidays.
- There was a 30% increase in distributor product searches from Q4 2022 to Q1 2023.
When it comes to product category searches, bags are still king…
- Bags were the most searched product category in January, February and March 2023, as they were in those months in 2021 and 2022.
...and pens have made a significant leap…
- Pens were the second-most searched category in January, February and March 2023, despite not claiming that spot in any of those months the prior two years.
…which means shirts took something of a dip.
- Shirts, which had been the second-most searched category in all months of Q1 in 2021 and 2022, dropped to the third-most searched product category in January, February and March 2023.

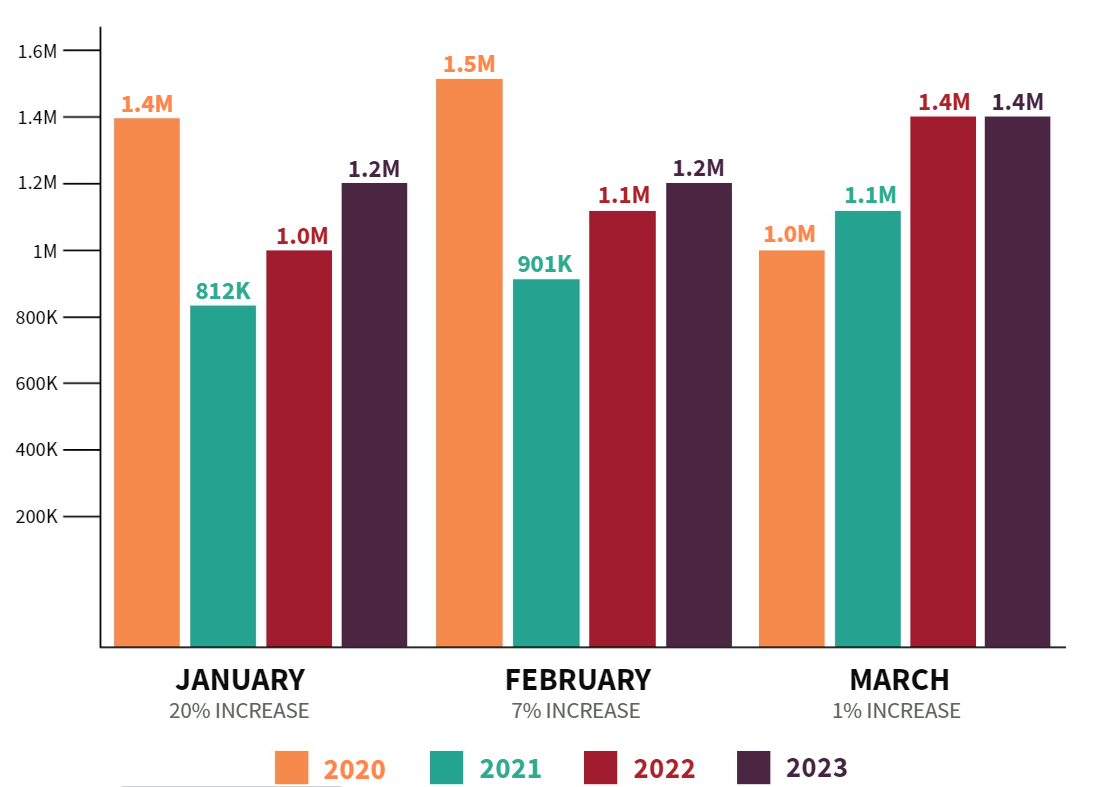
Meanwhile, distributors have been more commonly making sales presentations in early 2023, relative to Q1 of last year.
- Total sales presentations by distributors in January 2023 were up 18% over January 2022.
- Total sales presentations by distributors in February 2023 were up 9% over February 2022.
- Total sales presentations by distributors in March 2023 were up 1% over March 2022.

^Total Sales Presentations Created By Distributors Q1 Year-Over-Year Comparison
A full list of the top-50 product category searches for Q1 of 2023 include many of the usual suspects.
- Magnets made a leap into the top 25.
- Phone accessories moved into the top 50.
View The Full Report
The SAGE Global Statistical Report is a snapshot of how the industry is using one of its most powerful search tools. Information about trends, habits and volume can be gleaned by looking at the collected information.
To view the full report for Q1 of 2023, click here.